 CuraCourse
What you get
Python code editors run on a server with no screen, so plt.show() has no window to open and students see no chart. Add two small files to your course's code library and every Python code editor in the course shows plots right in the Result panel. Students write standard matplotlib code. They don't need to import anything extra.
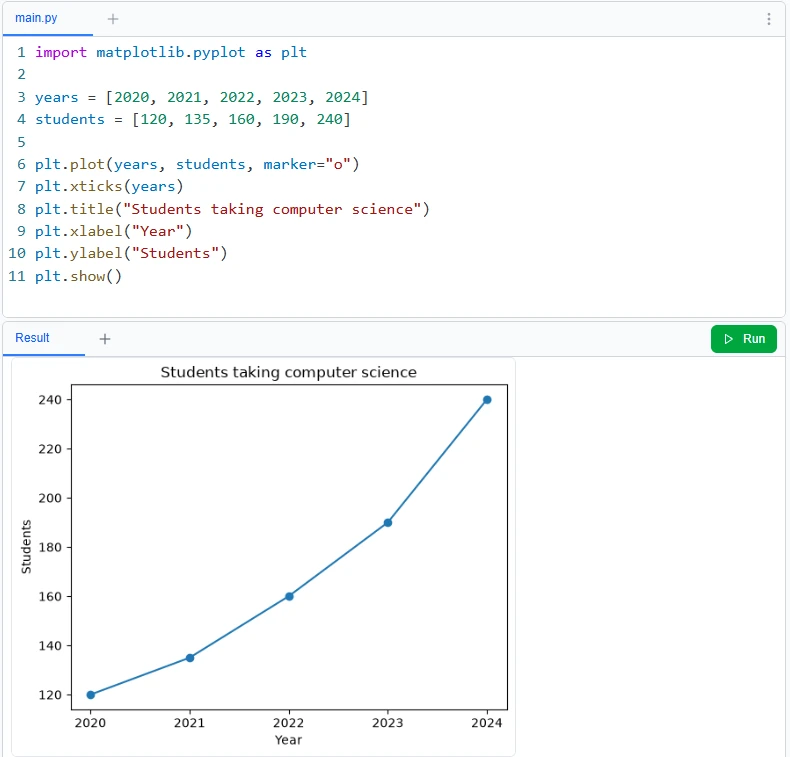
matplotlib, numpy, pandas, and seaborn are already installed, so nothing else needs setting up.
Download the files
- curacourse_plots.py turns each figure into an image in the code editor output.
- matplotlibrc tells matplotlib to use that file. Keep the name exactly
matplotlibrc, with no file extension. If your computer adds.txtto it, rename the file before uploading.
Add them to your course
- Open your course, choose Settings, then Blocks.
- Under Code editor → Library files, choose the Upload button (the up-arrow icon) and select both files.
- Keep both files at the top level of the library, not inside a folder.
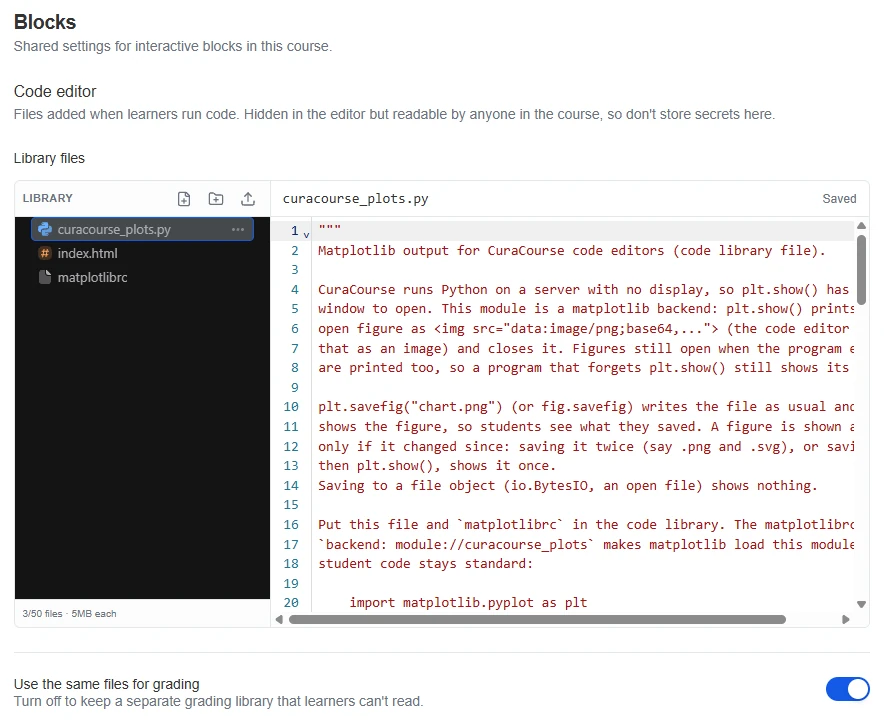
If Use the same files for grading is off, upload both files to the grading library too.
Using a book? Open the book's settings, upload both files to its Code library, and choose Publish library. Courses that use the book get the published version.
Write plot code as usual
import matplotlib.pyplot as plt

years = [2020, 2021, 2022, 2023, 2024]
students = [120, 135, 160, 190, 240]

plt.plot(years, students, marker="o")
plt.xticks(years)
plt.title("Students taking computer science")
plt.xlabel("Year")
plt.ylabel("Students")
plt.show()
plt.show()shows every open figure, then closes it. Call it more than once to show several charts.- Forgot
plt.show()? Figures still open when the program ends are shown anyway. plt.savefig("chart.png")saves the file as usual and also shows the chart, so students see what they saved. A figure only appears again if it changed: saving it as both.pngand.svg, or saving and then callingplt.show(), shows it once.- Subplots, bar charts, histograms, pandas
.plot(), and seaborn all work, because they draw with matplotlib.
Charts appear at a fixed resolution (a default figure is about 570×430 pixels). A dpi you pass to savefig changes only the saved file.
Grading plot programs
Each chart is printed to the program's output as an image. Code Grading compares that output, so a test that uses Exact match fails whenever the program draws a chart. Choose one of these instead:
- Partial match or Regex for the text the program prints, so the image lines don't matter.
- A hidden grader file that checks the plotted data (for example, the values in
plt.gca().lines) and prints a pass/fail line. See Code Grading examples. - AI Grading or Manual Score if you want to judge the chart itself.
Troubleshooting
- No chart, and the program ends without an error. Check that
matplotlibrcis in the library under that exact name, at the top level. If you can't add it, putimport curacourse_plotsat the top of the program, beforeimport matplotlib.pyplot. ModuleNotFoundError: No module named 'curacourse_plots'. The Python file is missing from the library, or it's inside a folder. Upload it at the top level.- The first run takes several seconds. matplotlib loads fresh each time a program runs. Later runs are usually faster.
- Charts show above the printed text. The Result panel lists images before text output, whatever order the program printed them in.
- Output too large. Program output is capped at 1 MB. A typical chart is 20–60 KB, so this only matters for programs that draw dozens of charts.